Special Flight Operations Certificate
_______________________________________________________________________________________________________________________________________________________________________________________________________________________________________________________________________________________________________________________________________________________________________________________________________________________________________________________________________________________________________________________________________________________________________________________________________________________________________
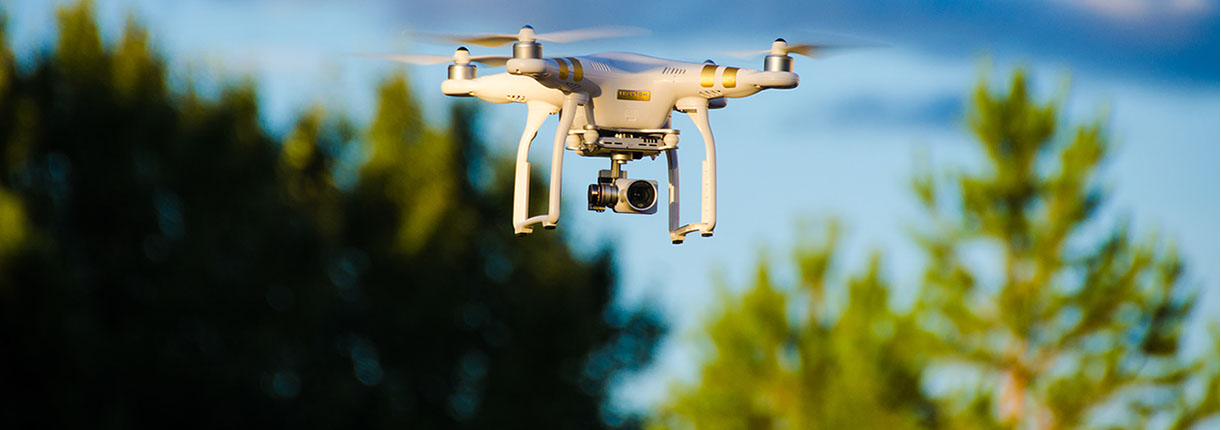
I am a registered Restricted UAV Operator in Alberta, Saskatchewan, and Manitoba.
I hold a Restricted Radio Operator Certificate and Private Pilot's License

SFOC
Certified
What is NDVI?
Normalized Difference Vegetation Index
History
NDVI Colour Gradients
The index produces black and white gradients which are then remapped to a variety of colour gradients to improve definition and make the images easier to interpret. Click on the tabs below to view gradient map colour patterns.
I have processed Normalized Difference Vegetation Index data from multiple platforms including drones, aircraft, high altitude balloons, and satellites.
The examples shown below were all processed form data off of a University of Saskatchwan Space Team high altitude balloon.
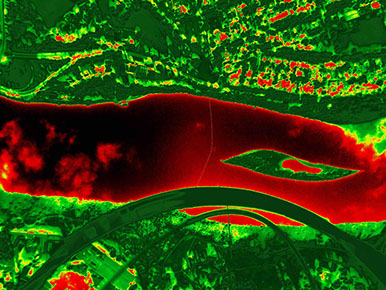
IR data over Saskatoon processed from a UofS Space Team high altitude balloon by Danno Peters - HD Red Green
Raw NDVI
HD Red Green
Land Cover
Green
Iron
RG Colour Blind
Red Green
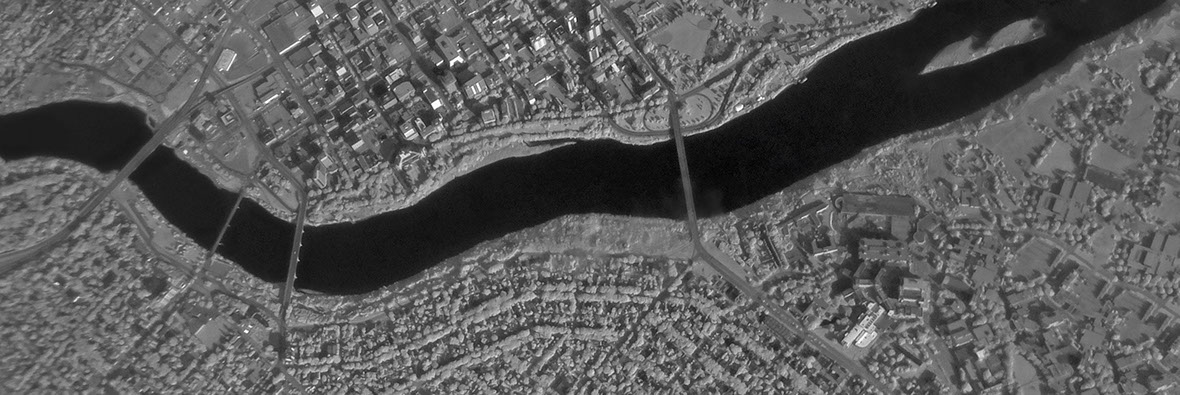
Composite of infrared images captured by the UofS Space Team over Saskatoon, compiled and processed by Danno Peters.
This is image is a matrix of NDVI values ranging from 1 (white) to 0 (black), which can be remapped to other colours.
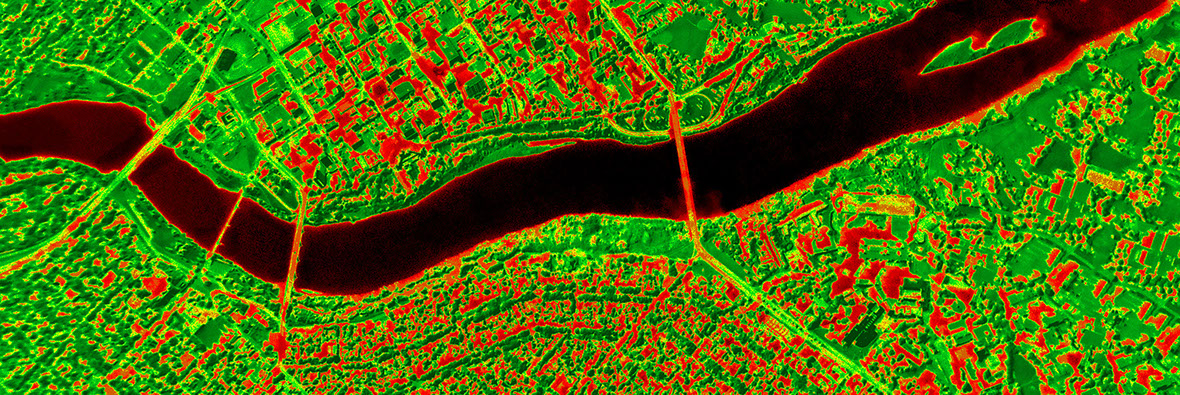
Composite of infrared images captured by the UofS Space Team over Saskatoon, compiled and processed by Danno Peters.
One of the most commonly used NDVI gradients. Dark Green (High), Yellow (Medium) and Red (Low) NDVI Values.
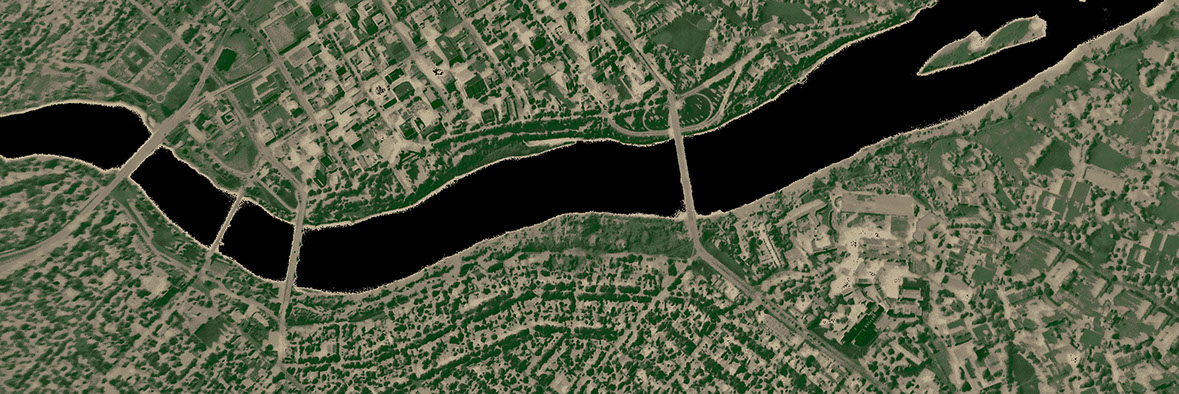
Composite of infrared images captured by the UofS Space Team over Saskatoon, compiled and processed by Danno Peters.
Commonly used for world and land use maps. Green (High), Brown (Medium), Sand (Low), Black (Zero).
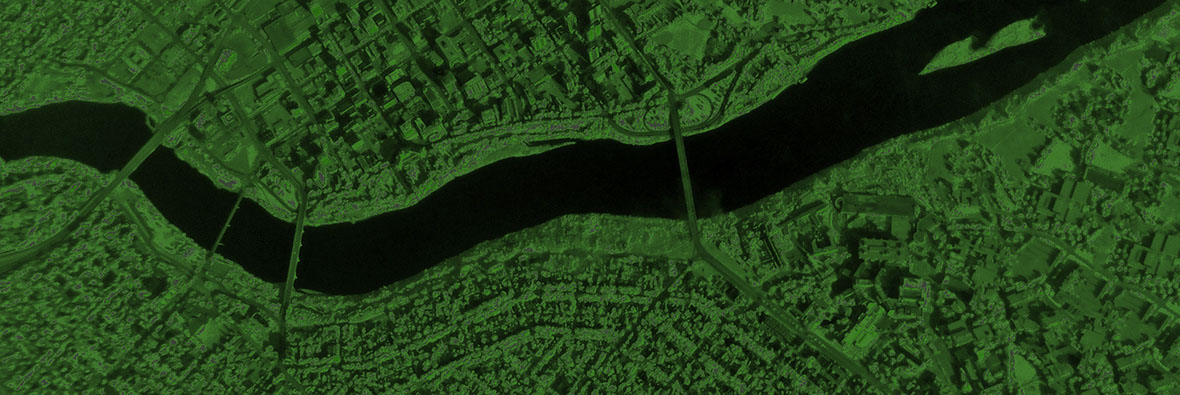
Composite of infrared images captured by the UofS Space Team over Saskatoon, compiled and processed by Danno Peters.
Used since humans can differentiate more shades of green than any other colour. Light Green (High), Black (Zero)
Composite of infrared images captured by the UofS Space Team over Saskatoon, compiled and processed by Danno Peters.
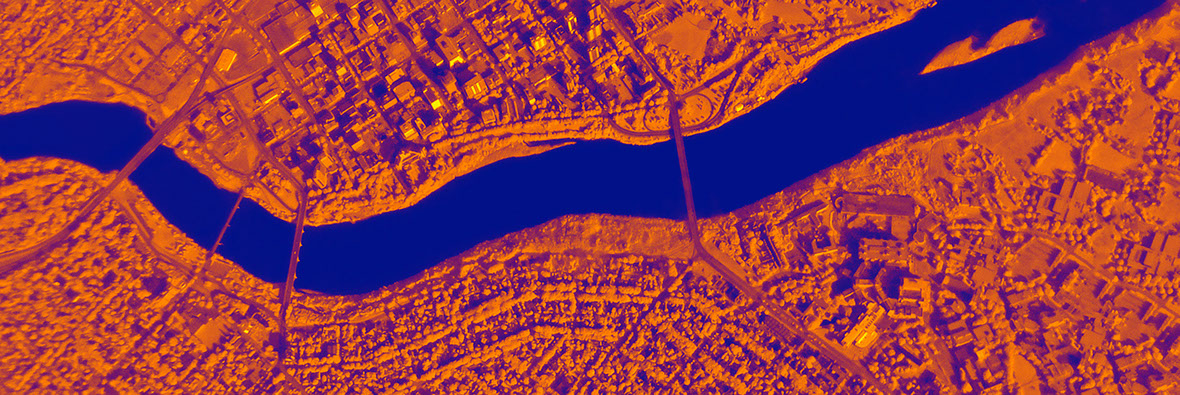
Produces a very high contrast between high and low values. Commonly used to differentiate vegetation types and canopy density. Yellow (High), Orange (Medium) and Purple (Low) NDVI Values.
Composite of infrared images captured by the UofS Space Team over Saskatoon, compiled and processed by Danno Peters.
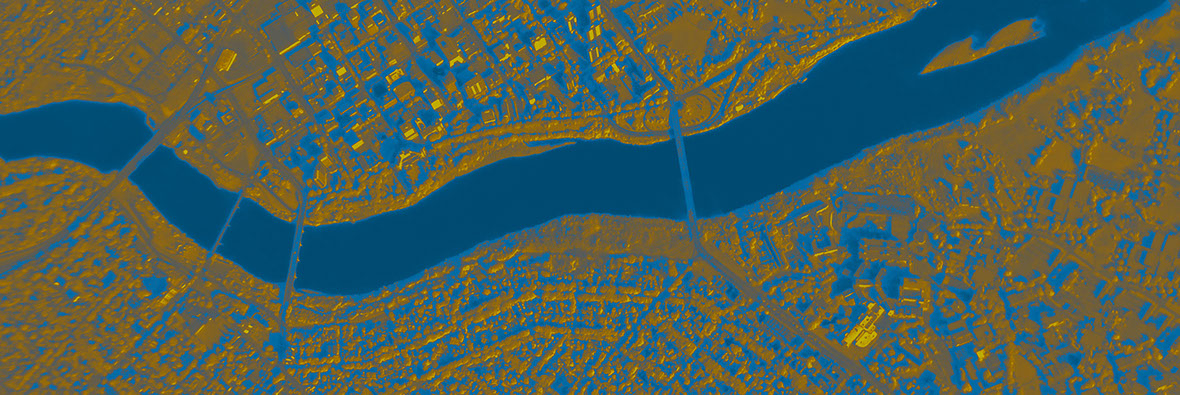
High contrast scale developed for those who are Red Green Colour Blind. Yellow (High) and Blue (Low) NDVI Values.
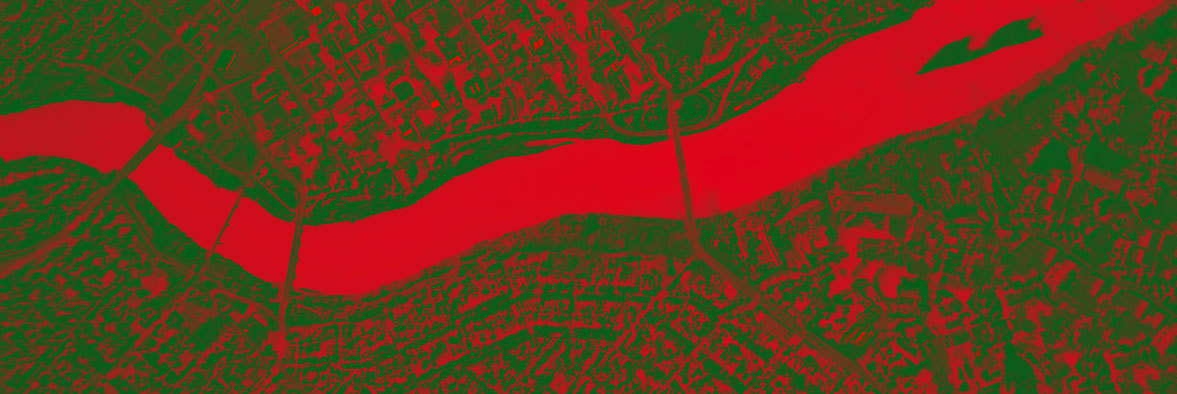
Composite of infrared images captured by the UofS Space Team (USST.ca) over Saskatoon, compiled and processed by Danno Peters.
One of the Traditional pallets used for low definition NDVI scans. Dark Green (High) and Red (Low) NDVI Values.
Basics of NDVI
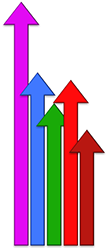
NDVI detects vegetation type, and density by comparing the relative intensities of reflected and emitted light.
Healthy/immature plants tend to absorb ultraviolet and reflect/emit infrared light.
Low NDVI ratings can indicate weak plants or mature Durum and other cereal crops.
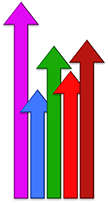
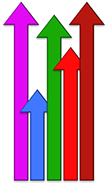


Graphic created by Danno Peters, creative commons shape vectors utilized
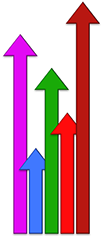

Main NDVI Types
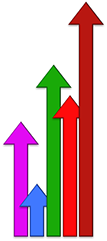
Standard NDVI
The intensity of IR and visual light are compared. This only requires an IR converted camera, but causes false positives from many IR reflective materials such as metal, clouds, and plastics.
ENDVI (Enhanced NDVI)
places an emphasis on green colour band. This removes some of the false positives but leads to false negatives. ENDVI is unable to accurately detect non green and/or flowering plants.
IR and UV NDVI
Combining infrared NDVI and ultraviolet plant health scans eliminates most false positives and negatives. Utilizing more colour channels produces higher definition scans and allows for differentiating different vegetation.
Graphic created by Danno Peters, creative commons shape vectors utilized
NDVI False Positives
How NDVI Works
Plant health and maturity are determined by detecting Chlorophyll A and Chlorophyll B by comparing the absorption of red light to the emission/reflection of infrared light.
The addition of ultraviolet scans allows for the detection of Carotenoids in addition to Chlorophyll A and B (which all absorb ultraviolet light).
High values of UV absorption and IR reflectance indicate efficient photosynthesis and therefore healthy and growing vegetation.
Absorbed Light
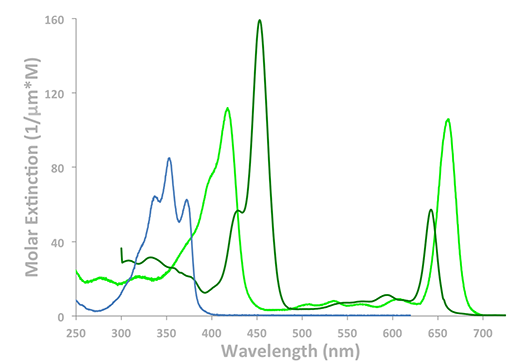
Absorption spectra graphic created by Danno Peters from data collected by J. Lindsey and colleagues at North Carolina State University
Emitted Light
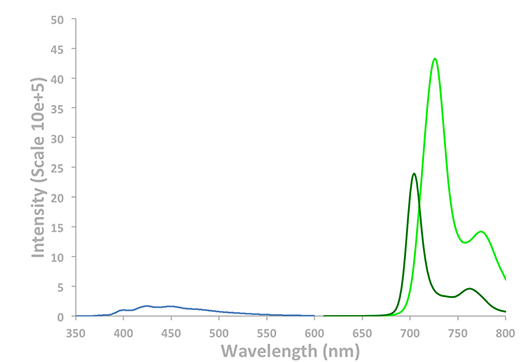
Emission spectra graphic created by Danno Peters from data collected by J. Lindsey and colleagues at North Carolina State University
Contact: info@DannoPeters.ca
DannoPeters.ca
©DannoPeters.ca 2012-2017